Learn · Industrial Maintenance
Predictive Maintenance: Vibration, Thermal, Oil
Part of Maintenance Tech to CMRP · step 23 of 30 · next: Root Cause Failure Analysis
In learning paths: Maintenance Tech to CMRP
Assumes you know: Preventive Maintenance
Predictive maintenance is work triggered by measured condition rather than by the calendar. You take a reading, compare it against what the machine used to do, and act when the trend says the machine is on its way to failing. Done properly it converts an unplanned breakdown at 2 a.m. into a planned repair on Thursday with the parts already on the bench.
*Learn the Trades is a free study resource. We are not a licensing body, an authorized training provider, or an exam administrator. Reading this page does not award any card, license, or certification. Always verify requirements with the issuing authority linked in the sources.*Why it matters on the job
The value of predictive maintenance is not that it finds faults. Any technician with a hand on a bearing housing finds faults. The value is lead time: knowing three weeks out, which is long enough to order the part, schedule the outage, brief the crew, and do the repair once instead of twice.
That lead time is also what makes the difference financially. The same bearing replacement costs one number as planned work and a much larger one as a breakdown that takes the line with it.
Three technologies, three kinds of evidence
Each of the three main condition technologies sees a different physical symptom, so they overlap less than people expect.
Vibration analysis reads motion at the machine. It is the strongest tool for rotating equipment (bearings, gears, unbalance, misalignment, looseness, resonance) because different faults excite different frequencies, so the spectrum separates causes that all feel identical through a glove.
Infrared thermography reads surface temperature. It is the fastest tool for electrical connections and panels, and it is useful on couplings, bearings, steam traps, insulation and refractory. A loose or corroded electrical connection heats up long before it fails, and it does so where a camera can see it from a safe distance.
Oil analysis reads the lubricant, and by reading the lubricant it reads the machine. It answers three separate questions in one sample: is the oil still fit for service (viscosity, additive depletion, oxidation), is the oil contaminated (water, dirt, coolant, fuel), and is the machine wearing (wear metals and particle counts).
Oil analysis deserves particular respect from maintenance technicians because contamination is usually a cause rather than a symptom. Water and dirt in a gearbox are not evidence of a failing gearbox; they are the reason it will fail.
Read the trend, not the reading
A single measurement is nearly useless on its own. The number that matters is how today’s reading compares with this machine’s own history.
That is why the first task of any PdM program is a baseline: readings taken when the machine is known to be in good condition, at a defined operating state, from marked measurement points, with the same instrument setup. Everything afterward is read against that.
Three disciplines make the trend trustworthy.
- Same point, same way, every time. A vibration reading taken 6 inches from last month’s point on a different axis is not the next value in the series; it is the first value in a new one.
- Same operating conditions. Load, speed and temperature move readings. A thermographic scan on a lightly loaded feeder tells you little, because the heat that reveals the fault has not been generated yet.
- Same interval, close enough. Trends are read against time. Ragged intervals blur the slope, and the slope is the part that gives you lead time.
Worked example: a pump bearing trend
Monthly overall vibration readings on the outboard bearing of a process pump, in inches per second:
| Month | 1 | 2 | 3 | 4 | 5 | 6 |
|---|---|---|---|---|---|---|
| Reading | 0.11 | 0.12 | 0.12 | 0.14 | 0.19 | 0.28 |
Months 1 to 3 are flat and establish the baseline at 0.11 in/s. Month 4 lifts slightly. Month 5 is the first honest signal: 0.19 in/s is 0.19 / 0.11 = 1.7 times baseline. Month 6 reaches 0.28 in/s, which is 0.28 / 0.11 = 2.5 times baseline, and the jump from month 5 is (0.28 − 0.19) / 0.19 = 0.474, a 47 percent rise in 30 days.
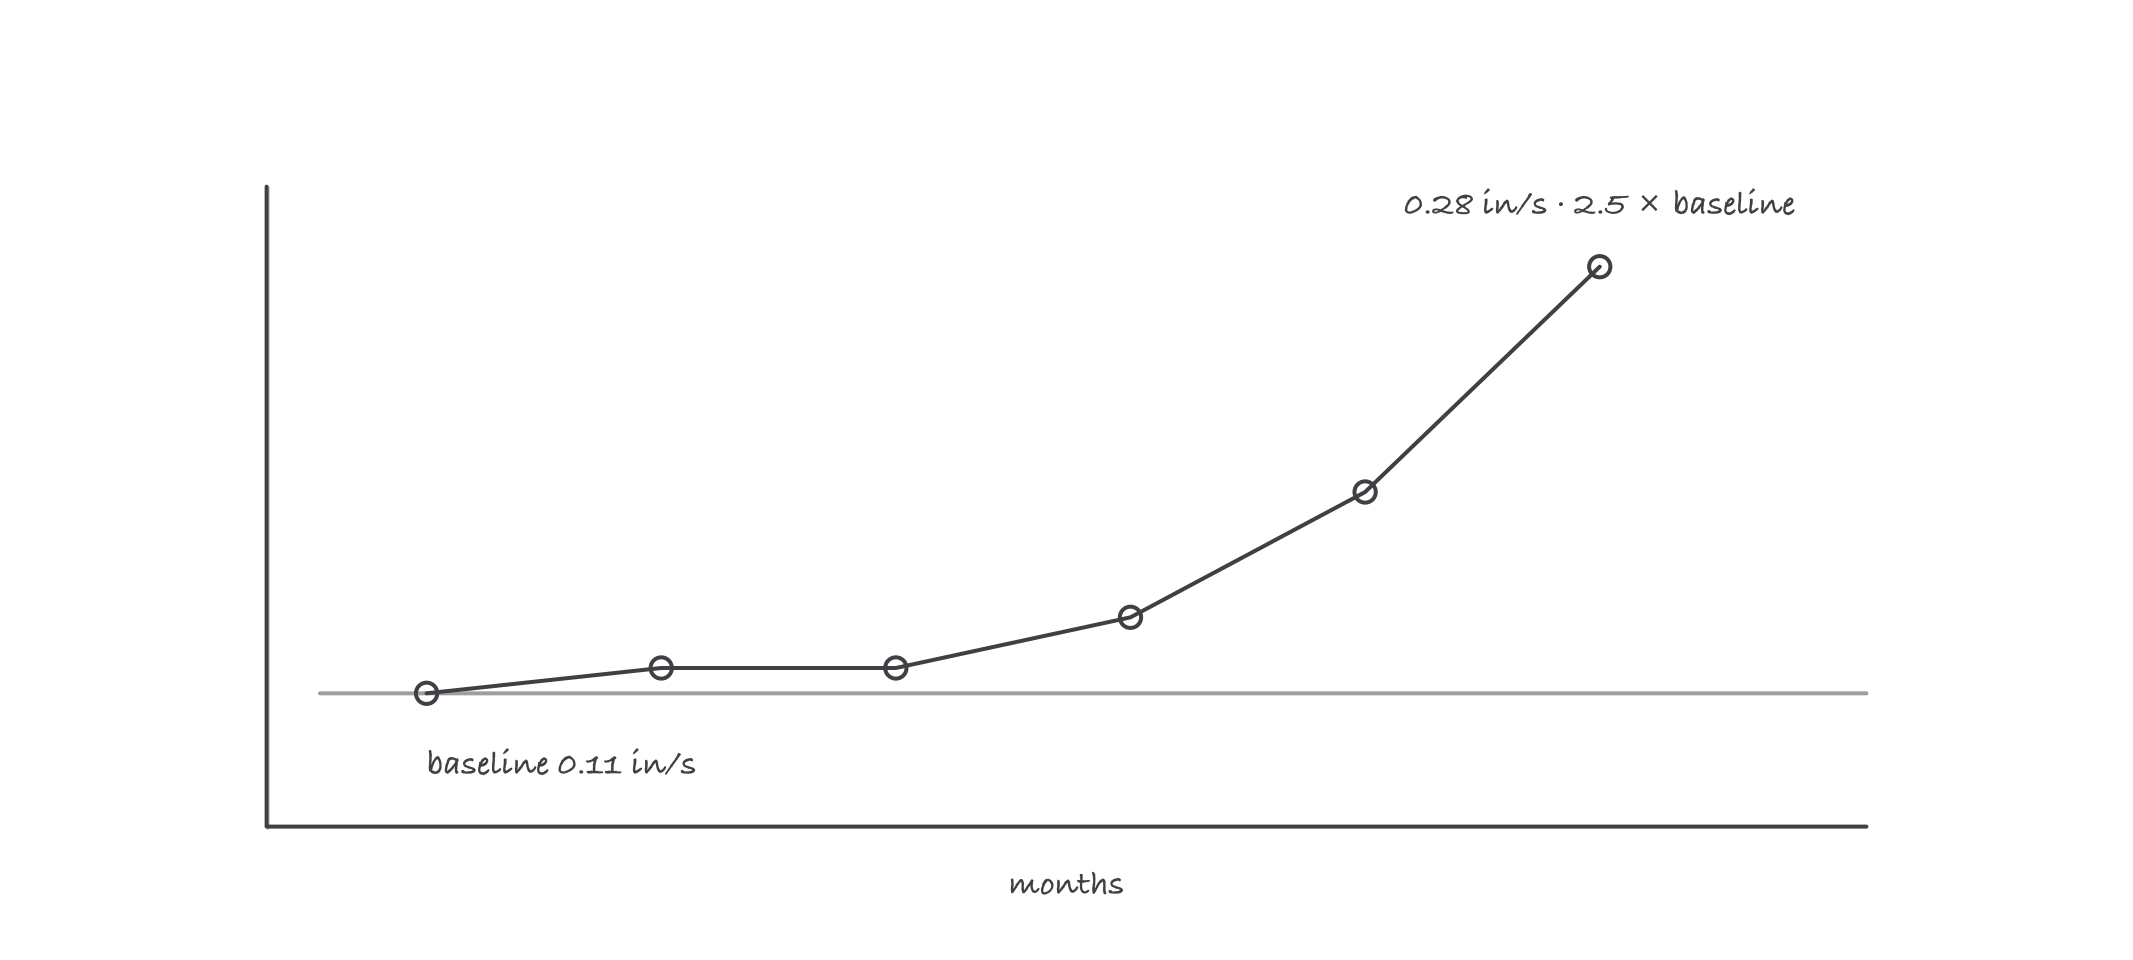
The single reading says 0.28; the trend says the rate of change is accelerating, and that is the part you act on
Two facts drive the decision, and only one of them is the number. The level has more than doubled, and the rate of change is increasing rather than steady. A steady climb gives you time to plan. An accelerating climb shortens the window every month, so the repair gets scheduled at the next available window rather than at the next convenient one.
What the overall level cannot tell you is what is wrong. That takes the spectrum, and the spectrum is where a vibration analyst earns their keep: a fault at running speed points one way; a fault at twice running speed points another. Confirm before you commit to a repair, because pulling the wrong component costs the outage twice.
Where it bites
- Unbalance and misalignment are different faults with a similar feel. Unbalance shows at running speed, misalignment tends to show at twice running speed. Balancing a misaligned machine leaves you with a balanced, misaligned machine.
- Predictive does not replace preventive. Condition monitoring tells you when to intervene. It does not clean a filter, grease a bearing or torque a foot bolt. Plants that cancel their PM program on the strength of a new PdM route usually rediscover this within a year.
- The sample point decides the answer in oil analysis. A sample drawn from the drain plug after shutdown reads the sediment, not the oil in service. Fit a proper sampling port and take it from live, turbulent flow.
- A thermographic image needs context to be a finding. A hot connection matters relative to its neighbors carrying similar load. Absolute temperatures without load, ambient and emissivity are photographs rather than measurements.
- Data nobody reads is worse than no data. A route collected monthly and reviewed annually produces exactly the same outage as no program, plus the cost of collection. The review is the deliverable.
Verified requirements
| Where | Expires | Renewal | Continuing education |
|---|---|---|---|
| United States (federal) | Yes | 3 years | 50 course hours per 3-year cycle, drawn from two or more of the recertification activity categories; recertification application due within 90 days of the expiration date or the exam must be retaken |
| United States (federal) | Yes | 3 years | 50 course hours per 3-year cycle, drawn from two or more of the recertification activity categories; recertification application due within 90 days of the expiration date or the exam must be retaken |
Information comes from issuing-authority sources. Confirm current rules, fees and eligibility with the authority before acting.