Learn · Solar
Site Assessment and Shading
Part of NABCEP PV Associate Prep · step 6 of 21 · next: System Sizing
In learning paths: NABCEP PV Associate Prep
A site assessment is the measured answer to one question: how much energy can this specific roof or field actually produce? Orientation, tilt, shading, roof condition, and the electrical service get read and recorded before anyone designs anything, because every promise in the proposal is built on these numbers.
Why it matters on the job
Production estimates are contractual in practice: customers finance systems against projected kWh. An assessor who misses a winter shade line or a failing roof creates either an underperforming system with an angry owner or a change order that eats the margin. Lead installers run assessments because the person who has stood on roofs knows what a satellite image hides.
What gets measured
Orientation and tilt. In the US, production peaks near true south; east and west roofs produce less but still work, and the falloff is gradual. Tilt interacts with latitude and season. Neither is a deal-breaker by itself; both feed the production model as numbers, not vibes.
Shading. The most consequential measurement. The sun rides a high arc in summer and a low one in winter, so an obstruction that is harmless in July can blank a roof face in December. A shade analysis maps the horizon (trees, chimneys, neighboring buildings, terrain) against the sun’s paths across the whole year, producing a solar-access percentage the estimate multiplies in. Remember the string behavior from the fundamentals: on string architectures, a small hard shadow can cost far more than its footprint.
Peak sun hours. A location’s solar resource compresses into one usable number: the equivalent hours per day of full-strength sun (1,000 W per square meter). A site logging 4.8 peak sun hours receives the energy of 4.8 hours of STC-grade sun daily, averaged across the year. It is the bridge between array kW and production kWh.
The roof and the service. Age and condition of the covering (reroofing under an array is misery: flag a roof near end of life now), rafter layout and structure, and the electrical service: busbar rating, main breaker, available space. The interconnection lesson shows why the busbar math decides system size as surely as the roof does.
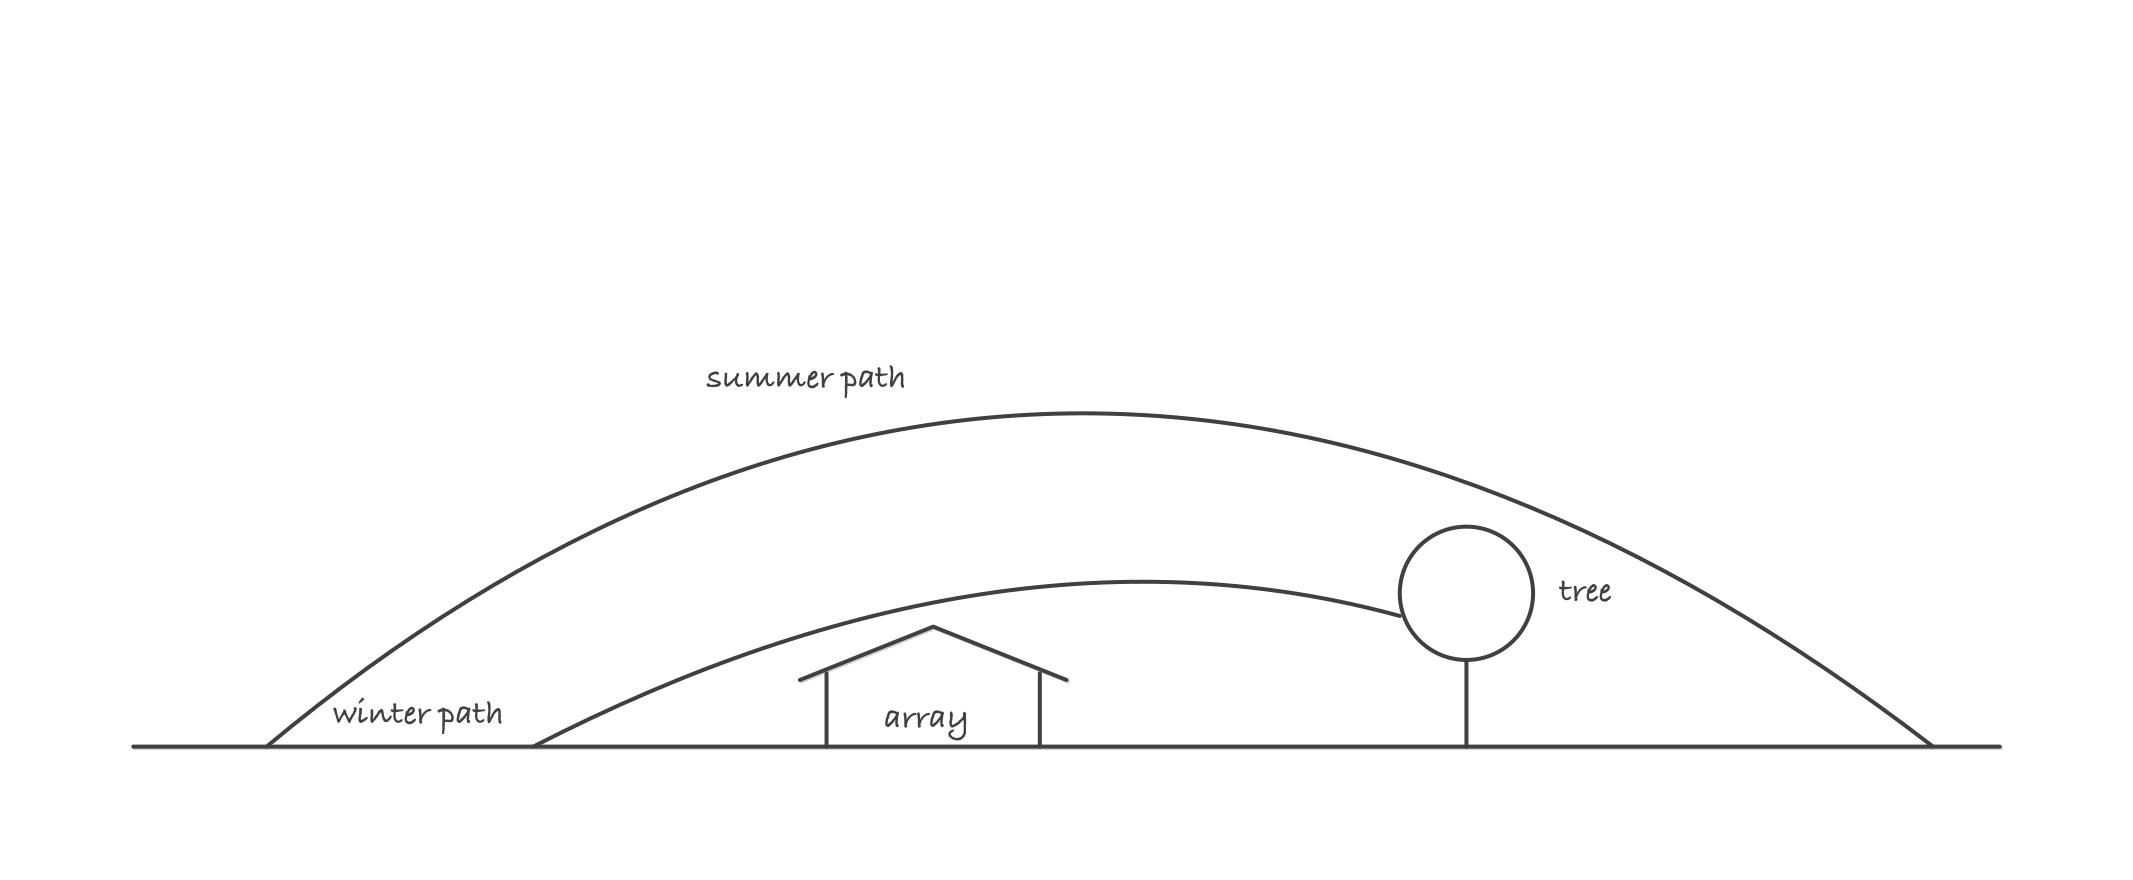
The same tree, two seasons: shade analysis exists because the December sun rides the low arc
Worked example
A 6.0 kW DC array is proposed on a site with 4.8 peak sun hours and an overall system derate of 0.8 (inverter efficiency, wiring, soiling, temperature):
- Daily: 6.0 kW × 4.8 h = 28.8 kWh × 0.8 = 23.04 kWh per day
- Annual: 23.04 × 365 = 8,409.6, call it 8,410 kWh per year
The shade analysis then reports 85 percent solar access:
- 8,409.6 × 0.85 = 7,148.2, call it 7,150 kWh per year
That 15 percent shade line was worth about 1,260 kWh a year: the difference between the proposal a customer signs and the one they regret.
Where it bites
- Winter shade hides in summer visits. Assess against the whole year’s sun paths, never against the shadow on the ground today.
- Peak sun hours are not daylight hours. A 14-hour summer day might deliver 6 peak sun hours. The number is energy, compressed, not time on a clock.
- The roof under the array matters as much as the sun above it. A 25-year array on a 20-year-old roof is a removal-and-reinstall bill in the making. Say so in the assessment.
- Assessment is measurement, not persuasion. The numbers go in the report as found. Rounding solar access up to close a sale is a production shortfall with your signature on it.