Learn · Solar
PV Operations, Maintenance and Troubleshooting
Assumes you know: Commissioning and Testing
Operations and maintenance is where a solar system either earns its 25-year promise or quietly fails it. O&M work is three disciplines in one: watching production data to catch problems early, testing arrays electrically to find the fault the data hints at, and keeping the service records that make warranty claims and certification applications possible. Commissioning handed you a baseline; O&M is the long conversation with it.
Why it matters on the job
Solar sells on lifetime energy, and nobody notices a roof full of glass underperforming by 15 percent unless someone is measuring. As fleets of installed systems age, O&M is also where the trade’s career growth is heading: the Bureau of Labor Statistics projects strong long-term growth for the PV workforce, and every system installed becomes a future service customer. NABCEP recognizes the discipline with a dedicated specialist certification, the PV Commissioning and Maintenance Specialist, whose project credits are earned in exactly this work.
Monitoring: the numbers watch the roof
Every monitored system produces a stream of energy data, and the core O&M skill is comparing actual production against expected. Expected production comes from the system’s size, its site, and the weather; the comparison is often expressed as a performance ratio: actual energy delivered divided by the energy the array should have produced under the conditions it actually saw.
The habit that makes monitoring work is thresholds. A system will never match its model day by day; what matters is a sustained gap. Set an investigation trigger, and when the ratio sits below it, go find the reason.
Worked example: reading a performance gap
An 8 kW residential system’s model expects 1,050 kWh for a sunny month. The monitoring portal reports 890 kWh delivered. Performance ratio for the month: 890 ÷ 1,050 = 0.848, call it 85 percent. The owner has noticed nothing; the inverter shows no fault. An 85 percent month against a weather-corrected model is a real signal, not noise. The likely suspects, in order of cheapness to check: new shading (a tree grew, a vent was added), soiling, a failed optimizer or module dragging one string down, or a string out entirely. Site data narrows it further: if the loss concentrates in afternoon hours, think shading from the west; if one string’s current runs low all day, think soiling or hardware on that string.
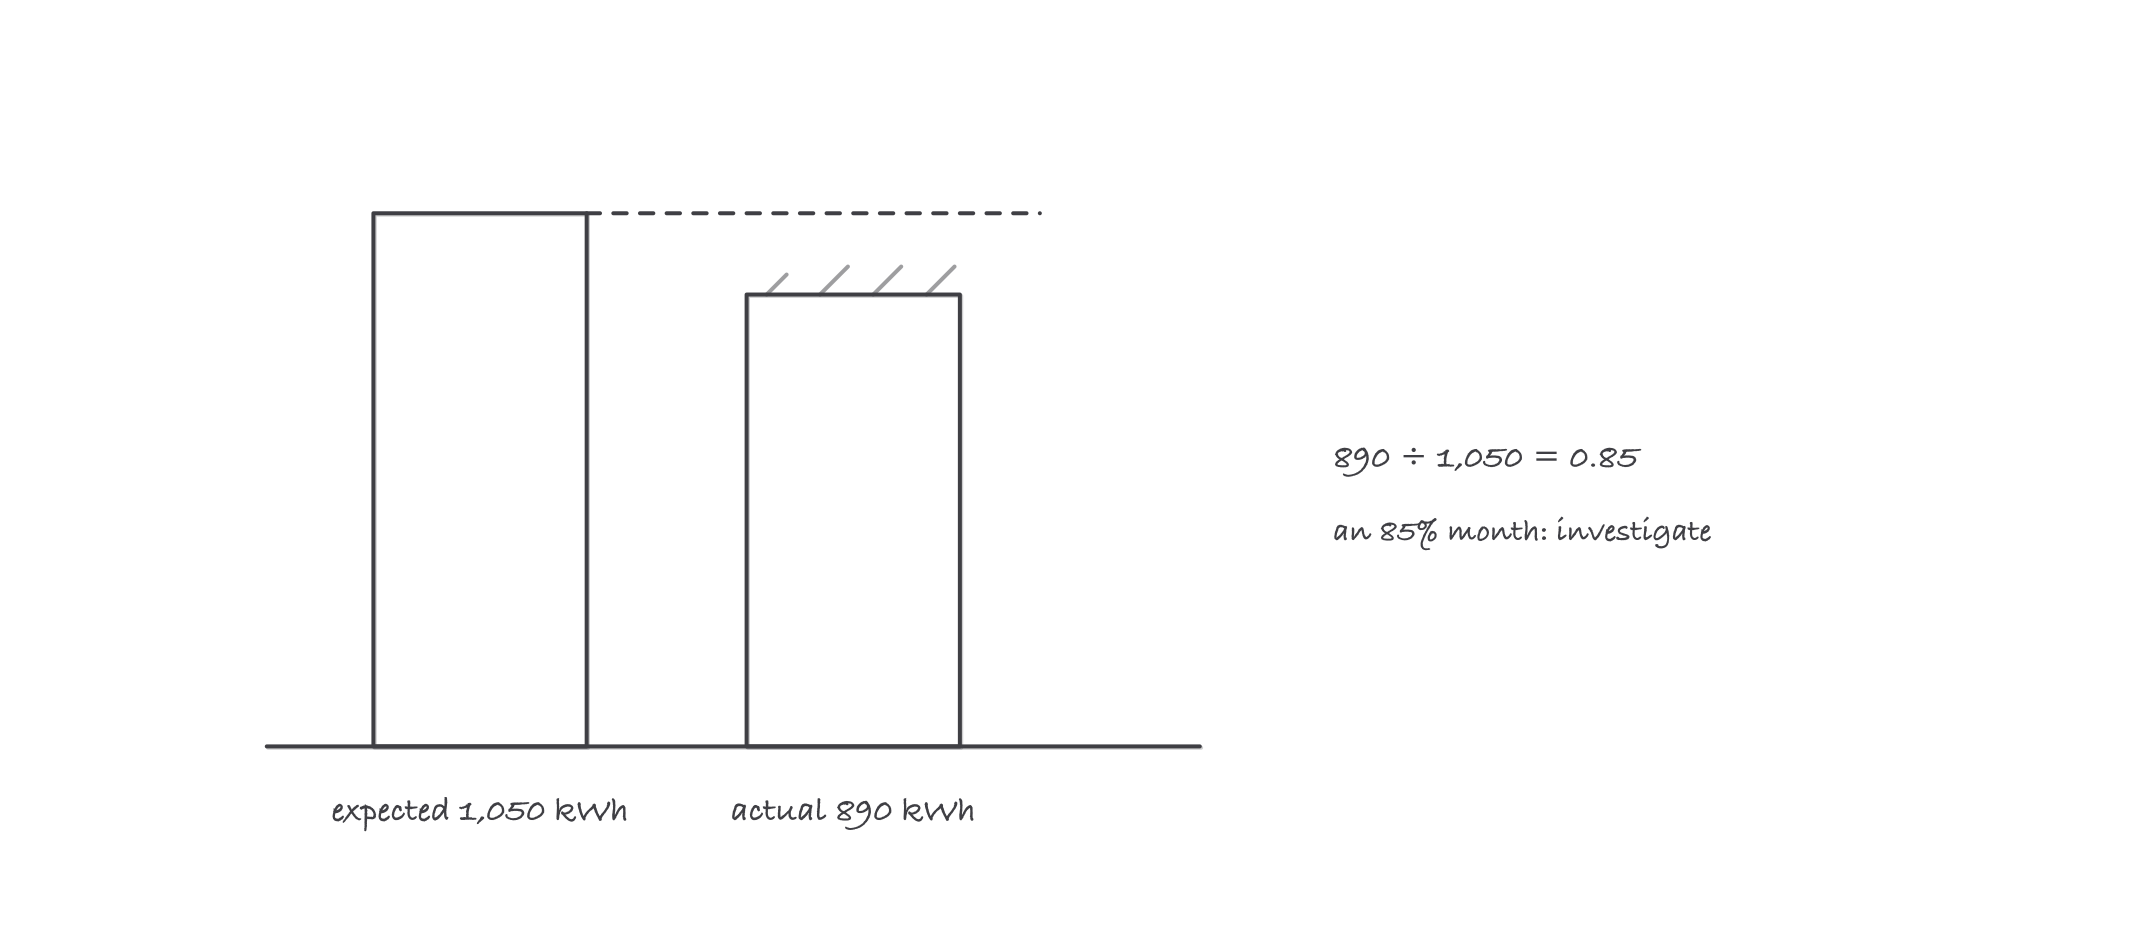
Actual over expected: 890 ÷ 1,050 = 0.85, and an 85 percent month is a signal
Testing: the meters interrogate the array
When monitoring says “something,” electrical testing says “what.”
IV-curve tracing sweeps a string from open circuit to short circuit and plots current against voltage. The shape is the diagnosis: a smooth curve at lower current than expected points to uniform soiling or degradation; steps or notches in the curve mean bypass diodes are active, the signature of partial shading or damaged cells; a shallowed slope near open circuit suggests rising series resistance, the fingerprint of corroding connections.
Insulation-resistance testing finds the ground faults. A megohmmeter between conductors and ground, with the array isolated, reveals insulation breakdown from abraded wiring, water in connectors, or damaged module backsheets, the faults that trip inverters at dawn when condensation peaks and mysteriously clear by noon.
Thermal inspection rounds out the kit: hot spots on modules and warm connections in combiners show up as temperature before they show up as failure.
Records: the paperwork is the product
Every visit produces a record: date, findings, measurements, and what was changed. Three parties will eventually demand them. Warranty administrators want evidence of the fault and its history before honoring module or inverter claims. Customers with production guarantees want the trail behind the numbers. And certification bodies want documented project work: NABCEP applications are built from verifiable records of real systems. An undocumented repair is, for all three audiences, a repair that did not happen.
Where it bites
- Chasing daily noise. Weather variance swamps single days. Investigate sustained ratios against weather-corrected expectations, not one cloudy Tuesday.
- Trusting the inverter’s self-reporting. “No fault” means no fault the inverter can see. String-level losses, soiling, and shading live below its alarm thresholds; that is what the performance ratio is for.
- Testing a live array like a dead one. Everything in the electrical-hazards lesson applies doubly during fault-finding, because the fault itself may have compromised the insulation you are relying on.
- Morning-only ground faults. Condensation-driven insulation faults clear as the array dries. If the customer reports dawn trips, test at dawn.
Exam relevance
For the NABCEP specialist exams, and the O&M domain of the PV Associate, this material is the tested core: what a performance ratio means, what IV-curve shapes indicate, what insulation testing finds, and why documentation standards exist. The worked example above is the shape of the exam question: given expected, actual, and a symptom pattern, name the likely cause and the next test.